Facial EMG for chewing is easy and clean with mobile recording: bipolar leads on the masseter plus a thumb control captured solid signals with quick impedance checks and live preview. In ASA, a 3 Hz high-pass and 50 Hz notch enabled peak detection, burst inspection, and painless export to Excel/MATLAB for rectified traces and workload metrics.
In this application case the eegosports system was used for the measurement of facial EMG, more specifically with a focus on mastication experiments.
The test setup consisted of an eegosports complete system with 64 referential channels. Of these, 4 referential channels were configured in a bipolar setup. One bipolar channel was located on the participants right thumb (Abducator Pollicis Brevis) and the other one on the participants right cheek muscle (Superficial Masseter).
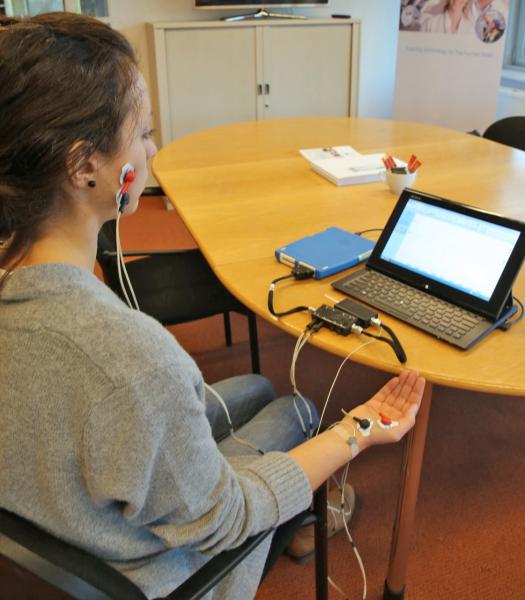
Figure 1: Experiment setup
Superficial Masseter
The superficial Masseter was located by palpation when the participant clenched his teeth. The bipolar EMG leads were connected to two Kendall ARBO ECG electrodes, 24mm in diameter spaced approximately 6 cm apart (heart to heart) (see also Mioche et al. 2004). Please note that the skin was not extensively prepared, but still impedances and signal quality were found to be satisfactory.
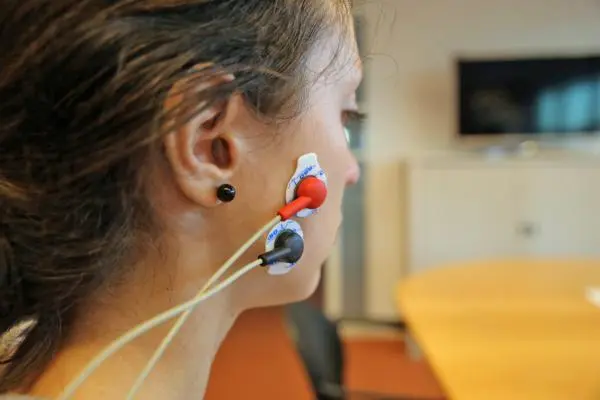
Figure 2: Electrodes placed on Superficial Masseter
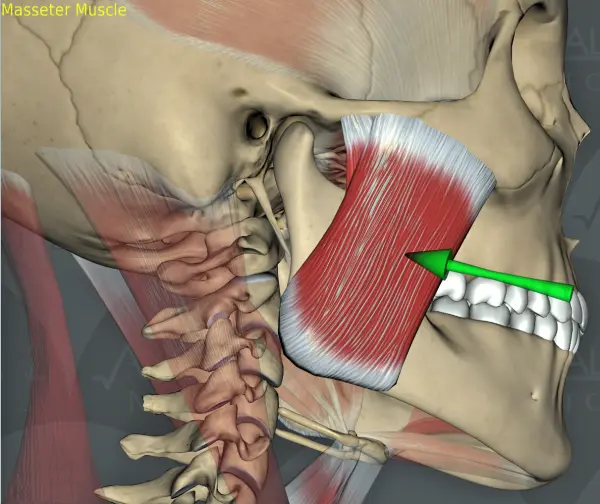
Figure 3: Anatomical image of Superficial Masseter
Abductor Pollicis
As a control, the participant’s left thumb was also included in the recording as a control (see Figure 4). Electrodes were placed approximately 7 cm apart on the Abductor Pollicis. The ground electrode can also be seen in Figure 4, it is placed on the boney area at the extremity of the underarm (radial styloid).

Figure 4: Overview of the EMG connections and the recording hardware
Anterior Temporalis
In a full mastication experiment, one might also want to include the Anterior Temporalis muscle in the data recording (and of course both muscles mirrored on the other side of the head), as this muscle is also heavily used during chewing. The setup for recording EMG at this location is however beyond the scope of this showcase.
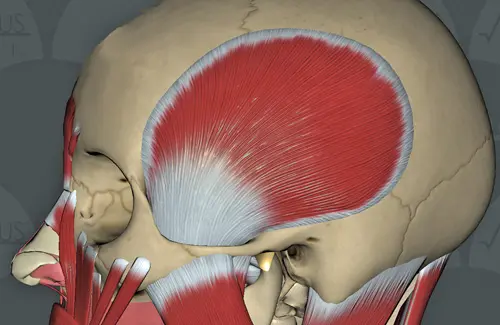
Figure 5: Anatomical image of the Anterior Temporalis muscle
Data recording
With the right montage data recording is quite straightforward. The montage is only configured once, and can be re-used with every recording. Impedance check shows the impedance for every electrode in kOhms. Assessment of data quality is easily done in the live EEG preview.
Data analysis
With the eego sports asa is shipped. asa is very powerful and advanced for EEG analysis and has some useful features for EMG analysis as well. First we apply some basic high pass filtering (3Hz - ∞) and notch filtering (50Hz).
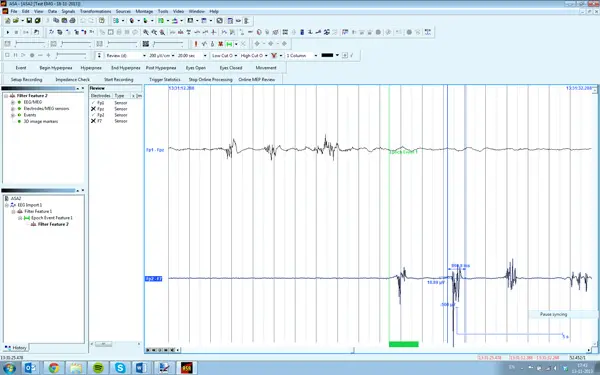
Figure 6: asa analysis software
After this, one can do automatic peak detection, averaging, Hilbert transformation, frequency analysis or manually inspect specific peaks. Below is an example of a burst of EMG. One can manually move the cursor over the burst to explore the data and automatically see the latency and height of the peak or offset.
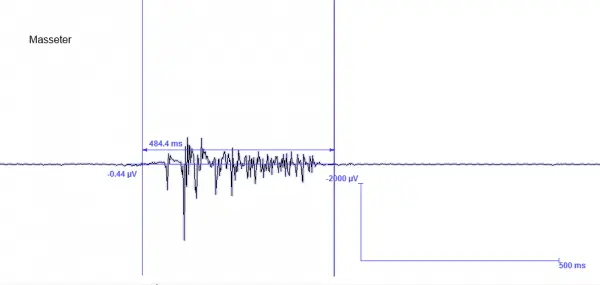
Figure 8: Extract of Masseter movements
Export to ASCII
Because ASA is mainly focused at EEG analysis, some functions which are specific to EMG analysis are not available. However, ASA can easily export to ASCII files, which are compatible with matrix-based software programs like Excel and MatLab. Plotting is often easy and straightforward. (Note that ASA by default plots EEG/EMG traces with the negative side of the axis pointing upwards, while Excel plots the positive values upwards, see Figure 9 below.)
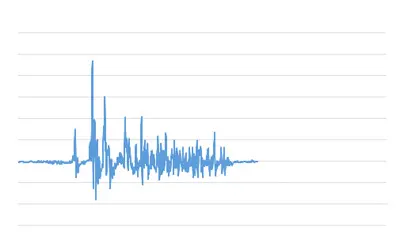
Figure 9: Filtered EMG
Rectifying the signal is easily done in for example Excel by using the ABS() function. The result can be seen in Figure 10 in the blue trace.
Other functions are also available, like calculating the average of the peaks, or the cumulative amount of work the muscle has done. (See below, orange for average and grey for cumulative work.)
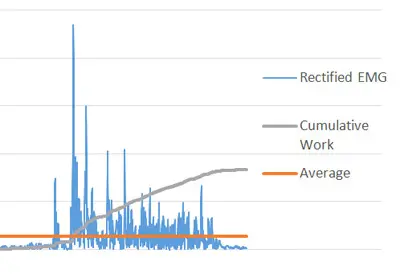
Figure 10: Rectified EMG